Uncertainty; Spreads Like Wildfire
- Bailey Rawden

- Jan 2, 2023
- 8 min read
An investigation into the relationship between uncertainty and credit spreads
There exists consensus amongst the post-2009 empirical economic literature that increases in associated measures of uncertainty result in decreases in economic activity, with frictions in the financial intermediation channel leading to larger, more persistent macroeconomic effects. Drawing on work from Woodford’s 2010 Journal of Economic Perspectives paper ‘Financial Intermediation and Macroeconomic Analysis’ a theoretical framework is established to explain how uncertainty shocks can negatively affect the supply of intermediated credit which can have propagation effects into the goods market channel of Romer’s IS-MP model with fixed money supply. Two recent sources of uncertainty, the 2008 Financial Crisis and the beginning of the Covid-19 Pandemic in 2020, are then investigated to provide empirical evidence for the relationship between uncertainty and aggregate activity. This relationship is then evaluated with discussion on the potential for simultaneous causality bias arising which could threaten its empirical validity.
Before analysis begins discussing the relationship between uncertainty and aggregate demand, it is crucial to understand what exactly uncertainty is and how it is measured. Here a distinction is made between probabilistic uncertainty and radical ‘Keynes-Knightian’ uncertainty. The type of uncertainty discussed in this paper refers to a distribution of future outcomes which are unknown yet in which data and statistical methods exist in order to establish reliable estimates. For Keynes-Knightian 'fundamental’ uncertainty, these characteristics do not exist; future outcomes are simply unknowable with equally unknowable probability distributions; for the purpose of this monetary analysis, it is probabilistic uncertainty which is the focus. Uncertainty implies that there is a high likelihood of negative economic events occurring in the future which include circumstances such as higher and more volatile inflation, anxieties over potential economic downturns, fear of unemployment, concerns over exchange rates or excessive government deficits. Due to the plethora of sentiment concerning the unpredictability of outcomes, it is difficult, near impossible to establish an objective measure of uncertainty, thus it is necessary that proxies are established when conducting analysis. One measure which has become ubiquitous amongst economic literature is the Chicago Board Options Exchange (CBOE) Volatility Index, most commonly referred to as the VIX. This proxy is designed to produce a measure of the constant 30-day expected volatility of the US stock market (CBOE, 2022). The VIX is not the only widely accepted proxy however, with Bekaert and Hoerova’s 2013 paper ‘Risk, Uncertainty and Monetary Policy’ introducing an accepted alternative measure: ‘The common variation in uncertainty across hundreds of economic series’. This proxy focuses on uncertainty around objective statistical forecasts rather than perceived uncertainty by market participants (IMF, 2017).
Although traditional IS-MP analysis, where ultimate savers lend to ultimate borrowers at policy rate , provides a simple way of illustrating how a central bank’s policy rate can affect economic activity, it is insufficient in describing the characteristics of real world economies, in which multiple interest rates are observed. Woodford (2010) develops a model which allows for multiple interest rates, where instead of ultimate savers lending directly to ultimate borrowers, lenders instead lend their funds to financial intermediaries, who then use these borrowed funds to supply intermediated credit to ultimate borrowers at a loan rate which exceeds their costs of funds by credit spread equal to the marginal cost of lending (Woodford, 2010). The following analysis introduces three main channels; (1) The Intermediation channel, whereby the demand for intermediation (XD), which represents the propensity for ultimate borrowers to pay a higher interest than the one necessary to induce savers to supply funds to intermediaries, intersects the supply of intermediation (XS), which represents the necessary spread required for financial institutions to supply a given volume of intermediated credit between savers and borrowers. The resulting intersection of XS and XD provides the equilibrium credit spread (w) and its associated equilibrium volume of credit. (2) The Loan Channel, where the supply of loanable funds for intermediaries is represented by LS and the demand for such funds at each possible value of the interest rate that must be paid by borrowers, is represented by LD. An important distinction to make with this channel is that the supply of funding and demand for loans are dependent on two different interest rates which allows the equilibrium level of lending to be a point other than where LS-LD intersects. The resulting disparity between interest rates therefore corresponds to the equilibrium credit spread determined from (1). The third channel (3) relates to the IS-MP channel in which the IS curve is obtained by tracing out the equilibrium level of interest from (2) for any given level of income. The corresponding MP curve represents the response of interest rates to a given level of output, arrived at via Taylor rule. Such a slope will be upward sloping due to it being determined for a given rate of inflation; a higher interest rate will be needed to offset the inflationary effects when output is high relative to potential output.
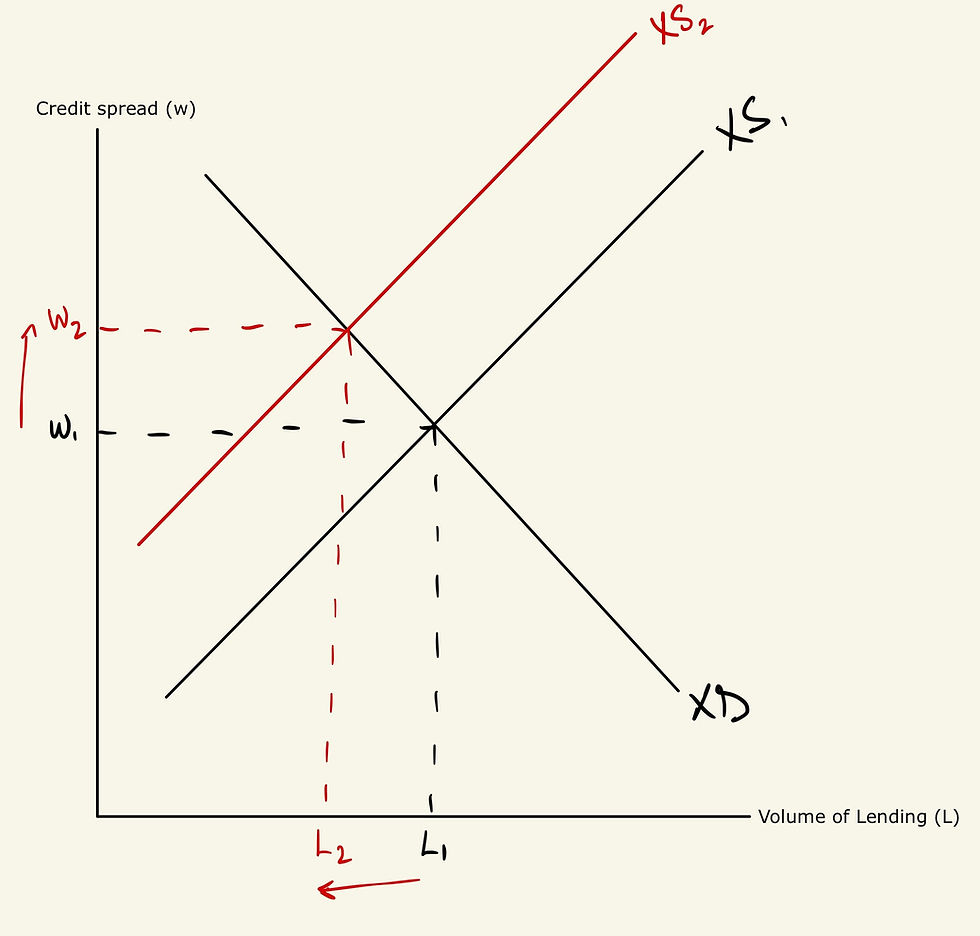
W represents the credit premium for given credit supply. Here, an uncertainty shock is added to the model which may change the expected outcomes of investing in certain projects. Intermediaries will only invest in new projects if they are sufficiently compensated for taking on additional risk which will induce them to demand higher interest rates for borrowers. Such an uncertainty shock is therefore likely to reduce the supply of intermediated credit as the marginal cost of lending to borrowers becomes larger as greater portfolio management is needed to ensure projects undertaken satisfy the additional risk requirements induced by uncertainty. Uncertainty is also likely to affect the risk aversion of the creditors to the intermediaries who, after the uncertainty shock, are likely to impose larger limits on the acceptable degree of leverage that the intermediaries can incur. As a result of this tightened leverage constraint, the capital of the intermediaries is likely to decrease. Such a decrease in the capital of intermediaries due to disruptions caused by uncertainty will reduce the supply of intermediated credit, thus shifting up the XS schedule in (1) from XS1 to XS2 which will result in a simultaneous fall in the equilibrium volume of lending (L1 to L2) and a higher credit spread (w1 to w2) for any level of economic activity.
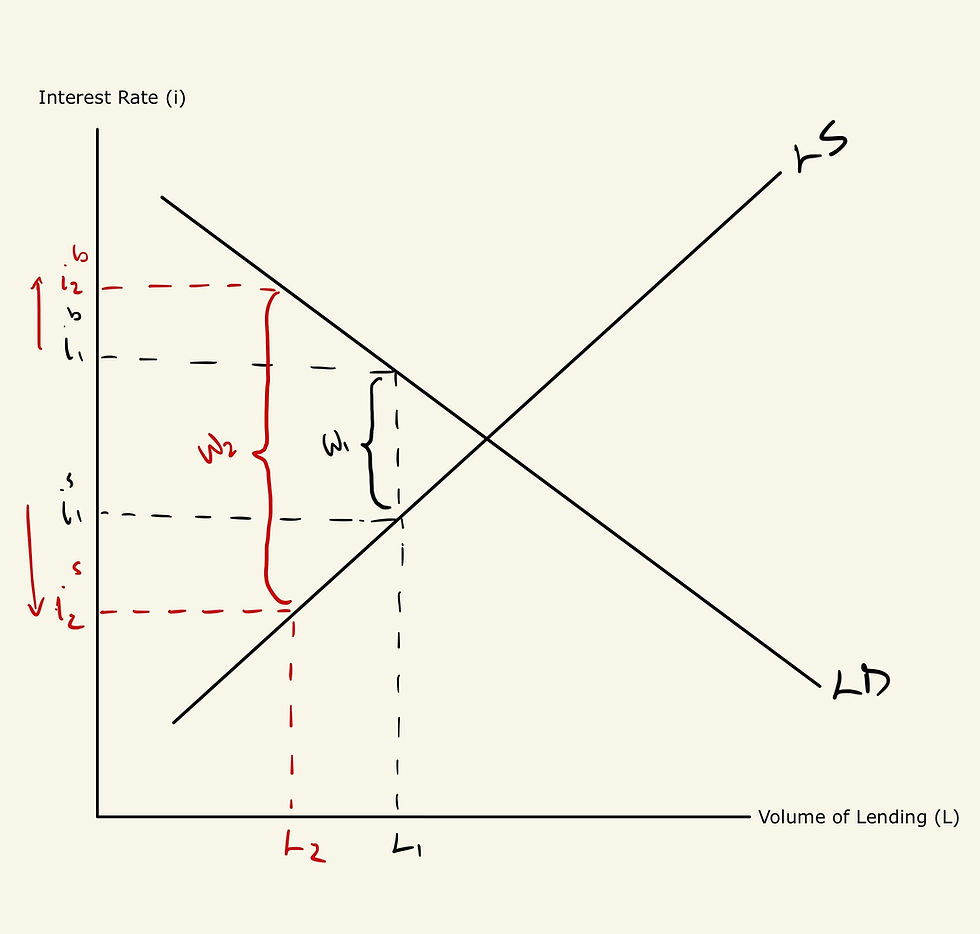
A larger credit spread implies that in (2), the interest rate for lending will be lower but the borrowing rate will increase for a given level of income, all whilst the volume of credit decreases from L1 to L2. As market lending dries up, banks are forced to hold onto more cash and lend less to consumers. With less money circulating in the economy, demand for goods and services decreases. Transposing this analysis to the IS-MP channel of (3), due to the reduction in the volume of credit for a given level of income, the IS curve will shift down to the left resulting in a lower equilibrium level of interest rate given by i2s . It is important to note that the IS plots the equilibrium value of is, not ib, as the policy reaction function specified by Taylor specifies a target for the interest rate paid to savers, not the loan rate for ultimate borrowers. It is assumed for the purpose of this analysis, that if the central bank decides not to respond with any monetary policy instrumentation, then an initial negative shift in the supply of intermediation, disrupted by a heightened sentiments of uncertainty, will result in a decline in both policy rate and a contraction in real economic activity and levels of output. Additionally, following this reduction in output in the IS-MP channel, it may feed back into the intermediation channel, with suppliers of funds to intermediaries choosing to purchase riskless assets, like government treasury bills, as uncertainty about the macroeconomy begins to compound. This is likely to further reduce the capital of the intermediaries, leading to larger losses for banks, resulting in an even greater tightening of credit. Thus, it is reasonable to assume that shocks which only seem of minor significance to individual firms can have substantial aggregate effects if the losses in question are concentrated in a sector of highly leveraged intermediaries which suffer significant reductions in their capital (Woodford, 2010).

To test the empirical validity of the preceding theoretical framework, VIX and Moody’s Seasoned BAA Corporate Bond Yield relative Yield on a 10-Year Treasury-Bill (BAA10YM) data is collected from the time of the financial crash of 2008 and the first quarter of 2020, to see if uncertainty in the form of VIX corresponds to a large increase in credit spread. Between September the 8th 2008, the day after Fannie Mae and Freddie Mac are bailed out by the US government to the tune of $187.5 billion, and November 20th 2008, the VIX jumps by 55 basis points to its highest ever recorded volatility measure; a figure 3 times higher than initially at the start of September. This VIX excessive figure corresponds to the near peak of the BAA10YM spread, suggesting that heightened certainty, proxied by VIX, corresponded to a higher credit spread during the financial crisis of 2008 which would have led to substantial effects on economic activity as the volume of loans dried up. Comparing these results to that of the first quarter of 2020, the period of time following the outbreak of the Covid-19 virus when national governments were still trying to determine adequate responses to the pandemic, uncertainty as to what restrictions were to be put in place were rampant; displayed eloquently in the sharp rise in VIX on the 30th of December 2019 as the WHO declared a public health emergency, followed by another sharp rise at the end of March 2020 as both the US and UK announce lockdown measures. Both rises in VIX during this periods offer a strong correlation to the sharp rise in the BBA10YM, thus there exists reasonable evidence in both periods to suggest that uncertainty (in the form of a VIX proxy) heavily disrupted the supply of intermediated credit, resulting in a larger credit spread which would have had severe implications on the level of economic activity. The latter comment holds true also, with data from the Federal Reserve indicating that US real GDP fell by 4.3% from its peak in 2007Q4 to its trough in 2009Q2, and data from Reuters estimating that the US economy contracted 19.2% during the COVID-19 pandemic.


A challenge to this evidence is the fact that there is no objective measure of uncertainty, with different types explored in the introduction affecting different sectors in asymmetric ways. Regardless of this empirical inconvenience, there remains consensus in the economic literature, pioneered by Bachmann and Cesa-Bianchi utilising various uncertainty proxies, which all unanimously conclude that results are not shock-specific. A larger problem faced with empirical analysis of uncertainty is that uncertainty tends to arise during recessions, meaning that when uncertainty increases it tends to be during times when the expectation is likely to be negatively affected. Therefore it remains a possibility that the negative effects of uncertainty are in fact the effect of the recession, which causes uncertainty to increase. This would introduce simultaneous causality bias into the empirical results which could seriously threaten its validity.
There exists no objective measure of uncertainty, but useful proxies like the VIX exist as a way of gauging the level of uncertainty in sectors such as the equity market. With this proxy, there exists significant evidence to suggest that an increase in uncertainty affects the supply of intermediation which leads to larger credit spreads between suppliers of finance and ultimate borrowers. Such spreads lead to a reduction in the volume of loans which then depresses aggregate demand in the IS channel resulting in lowered economic activity. Analysing data from two periods of uncertainty, the 2008 financial crash and start of the 2020 pandemic, an increase in the VIX led to significant increases in the spread between US T-bills and the BAA10YM, both followed by significant declines in economic output as a consequence.
Bibliography
Athanikar, M. (2021). “4 Things to Understand About Credit Spreads” [online]
Bachmann, R., Elstner, S., & Sims, E. (2013). “Uncertainty And Economic Activity: Evidence from Business Survey Data”American Economic Journal
Bank of England. (2018). “The Financial Crisis- 10 years on”
CAGE. (2019). “Which way now? Economic policy after a decade upheaval” Centre for Competitive Advantage in the Global Economy, University of Warwick, The Social Market Foundation [online]
Cesa-Bianchi et al (2014). “Uncertainty and Economic Activity: A Global Perspective”. IDB Working Paper Series, No. IDB-WP-510, Inter-American Development Bank (IDB), Washington, DC
CBOE. (2022). “VIX Index Dashboard” [online]
Federal Reserve History. (2014). “The Great Recession” Federal Bank of Cleveland [online]
Federal Reserve Bank of St. Louis. (2021). “Credit Spreads during the Financial Crisis and COVID-19 Pandemic” [online]
Federal Reserve Economic Data. (2022). “Moody's Seasoned Baa Corporate Bond Yield Relative to Yield on 10-Year Treasury Constant Maturity (BAA10YM)”
Knight, F. H. (1921). “Risk, Uncertainty, and Profit”. Boston, MA: Hart, Schaffner & Marx; Houghton Mifflin Company
Macrotrends. (2022). “TED Spread- Historical Chart”
Macrotrends. (2022). “VIX Volatility Index- Historical Chart”
IMF. (2017). “Measuring Global and Country-Specific Uncertainty”
Woodford, M. (2010). "Financial Intermediation and Macroeconomic Analysis." Journal of Economic Perspectives, 24 (4): 21-44.